SLYR ESRI to QGIS compatibility suite – April 2020 update
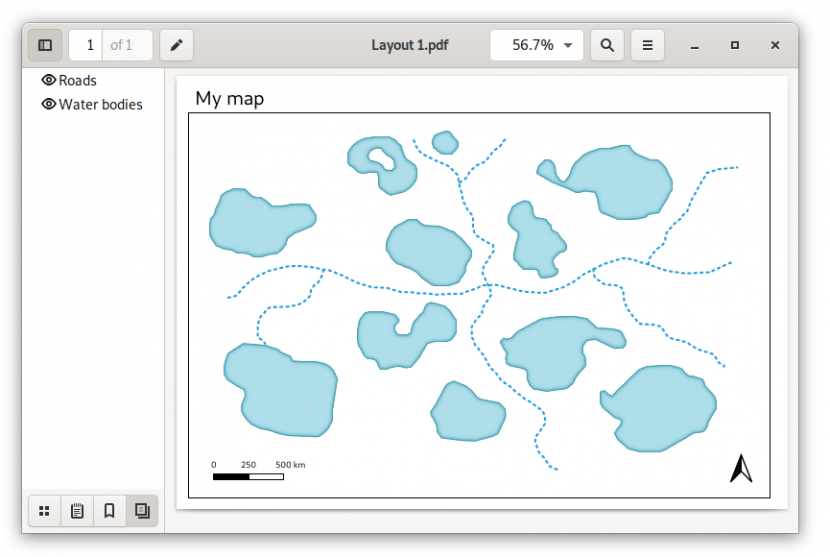
Since the last update, our “SLYR” ESRI to QGIS compatibility suite has gained a ton of new functionality, including full support for conversion of ArcMap MXD documents (with page layouts!). In this update, we’ll explore some of the new functionality available in the tool — but instead of focusing solely on SLYR, this time we’ll also explore the enhancements we’ve been making in QGIS itself that have helped improve the quality of ArcMap document conversion. While many of these enhancements are already available to all users of QGIS 3.12, others are exciting additions to the upcoming QGIS 3.14 release. Let’s dive in! Improved legend customisation One shortcoming we realised early on during our work on SLYR was that QGIS map […]
Read more