QGIS Add to Felt Plugin – Phase 2

We have been continuing our work with the Flagship sponsor of QGIS – Felt to develop their QGIS Plugin – Add to Felt  that makes it even easier to share your maps and data on the web. What is the ‘Add to Felt’ QGIS Plugin? The ‘Add to Felt’ QGIS Plugin is a powerful tool that empowers users to export their QGIS projects and layers directly to a Felt web map. This update introduces two fantastic features: Single Layer Sharing: You can now share a single layer from your QGIS project to a Felt map. This means you have greater control over which specific data layers to share, allowing you to tailor your map precisely to your audience’s needs. Map […]

Read more

‘Add to Felt’ QGIS Plugin

The gift economy of Open Source is community driven and filled by folks with ideas that just go for it! We at North Road are blessed that we get to join these creatives on their journey in order to get their products to you. Recently, the first QGIS flagship sponsor, Felt, engaged us to further strengthen their support for the up to 600,000 daily QGIS users to integrate their workflows between QGIS and Felt. The result is the “Add to Felt” QGIS Plugin, which makes it super-simple to publish your QGIS maps to the Felt platform. To get started, install the Add to Felt Plugin from the QGIS Plugin manager. If you don’t have a free Felt account, you’ll need to […]

Read more

QGIS 3.28 improvements for working with ESRI formats and services

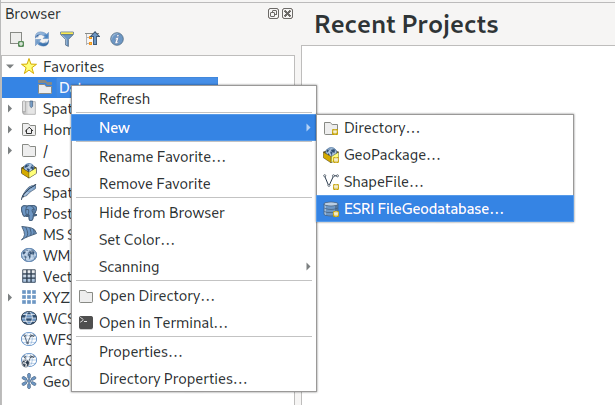
The QGIS 3.28 release is an extremely exciting release for all users who work in mixed software workplaces, or who need to work alongside users of ESRI software. In this post we’ll be giving an overview of all the new tools and features introduced in 3.28 which together result in a dramatic improvement in the workflows and capabilities in working with ESRI based formats and services. Read on for the full details…! Before we begin, we’d like to credit the following organisations for helping fund these developments in QGIS 3.28: Naturstyrelsen, Denmark Provincie Gelderland, Netherlands Uppsala Universitet, Department of Archaeology and Ancient History Gemeente Amsterdam Provincie Zuid-Holland, Netherlands FileGeodatabase (GDB) related improvements The headline item here is that QGIS 3.28 […]

Read more

Line Label Placement: Our gift to the QGIS community!

If you’re a follower of North Road’s social media accounts, it probably comes as no surprise to hear that we love sharing regular tips and useful suggestions about working with spatial data on these channels. Recently, we realised we were close to a new milestone of 4k followers of our Twitter stream. This milestone gave us the perfect excuse to give something back to all these followers! So we ran a little promo, where we promised that if we hit 4k followers we’d implement a new feature in QGIS, as determined by a popular vote: *GIVE AWAY*We’re nearly at 4K followers! 🥳We love you guys, so as a thank-you to our wonderful community for sharing and liking our tweets we […]

Read more

QGIS Processing, Model Designer and ETL Campaign crowdfund launched!

QGIS Processing offers a rich and expandable set of algorithms which can operate on spatial data, along with a powerful Model Designer which allows users to string together these algorithms to create custom workflows. Since its introduction in QGIS 2, the Processing framework has seen an intensive amount of development and optimisation efforts. In recent QGIS releases it offers a very user-friendly way of performing complex spatial data processing tasks, all without requiring ANY expensive third-party tools or software licenses! At North Road we are passionate about the QGIS Processing framework, and have invested considerable effort in this framework over the past 5 years. We’re proud to announce that our latest crowd-funding campaign is focused on further expanding the capabilities and flexibility […]

Read more

QGIS Print Layouts Graphs and Charts Campaign – Complete!

Last week saw the exciting release of version 3 of the QGIS DataPlotly plugin, which incorporates all the work done as a result of our Print Layouts Graphs and Charts crowdfunding campaign crowd funding campaign. Now, beautiful charts and graphs are available directly within QGIS print layouts, and all it takes is the easy installation of the “DataPlotly” plugin from your QGIS install! In this post we’ll showcase the functionality which has been added during this campaign, and which is available today in the plugin. UI modernisation and tweaks First up, during our work on this plugin we’ve invested some time in refreshing the plugin’s UI to ensure it follows all the widget conventions used elsewhere in QGIS. Now, the […]

Read more

SLYR ESRI to QGIS compatibility suite – October 2019 update

Recently, staff at North Road have been hard at work on our SLYR “ESRI to QGIS compatiblity suite“, and we thought it’s time to share some of the latest exciting updates with you. While SLYR begun life as a simple “LYR to QGIS conversion tool”, it quickly matured into a full ArcGIS compatibility suite for QGIS. Aside from its original task of converting ESRI LYR files, SLYR now extends the QGIS interface and adds seamless support for working with all kinds of ArcGIS projects and data files. It’s rapidly becoming a must-have tool for any organisation which uses a mix of ESRI and open source tools, or for any organisation exploring a transition away from ArcGIS to QGIS. Accordingly, we […]

Read more

QGIS Print Layouts Graphs and Charts — Beta Out Now!

Thanks to the success of our recent QGIS Print Layouts Graphs and Charts crowdfunding campaign, staff at North Road and Faunalia have been busy updating and improving the QGIS “DataPlotly” plugin with the goal of allowing beautiful charts inside your print layouts. We’re super-excited to announce that the beta release of this new functionality is now available! With this beta installed, you’ll see a new icon in your QGIS Print Layout designer window: Clicking this button will allow you to draw a new plot onto your print layout, just like you would any other standard layout item (like legends, scalebars, etc). Any print layout chart can be customised by right-clicking the chart and selecting “Item Properties“. This will open a […]

Read more

QGIS 3.10 Loves Geospatial PDF!

Recently, we’ve been working on an exciting development which is coming soon in QGIS 3.10… support for Geospatial PDF exports! This has been a long-desired feature for many QGIS users, and it was only made possible thanks to a group of financial backers (listed below). In this post, we’re going to explore these new features and how they improve your QGIS PDF outputs. Geospatial PDFs can now be created either by exporting the main QGIS map canvas, or by creating and exporting a custom print layout. For instance, when you select the “Save Map as PDF” option from the main QGIS window, you’ll see a new group of Geospatial PDF related options. At its most basic, Geospatial PDF is a […]

Read more

QGIS Print Layouts Graphs and Charts — target reached!

We’ve just passed the extended deadline for our recent QGIS Print Layouts Graphs and Charts campaign, and the great news is that thanks to a large number of generous backers we’ve successfully hit the target for this campaign! This has only been possible thanks to the tireless work of the QGIS community and user groups in promoting this campaign and spreading the word. The Print Layouts Graphs and Charts campaign is a joint effort with our friends at Faunalia, so we’ll soon be starting work together on all the wonderful new functionality heading to the QGIS DataPlotly plugin as a result. The work will be commencing late June, just after the QGIS 3.8.0 final release. Keep an eye out for […]

Read more