QGIS Print Layouts Graphs and Charts Campaign – Complete!

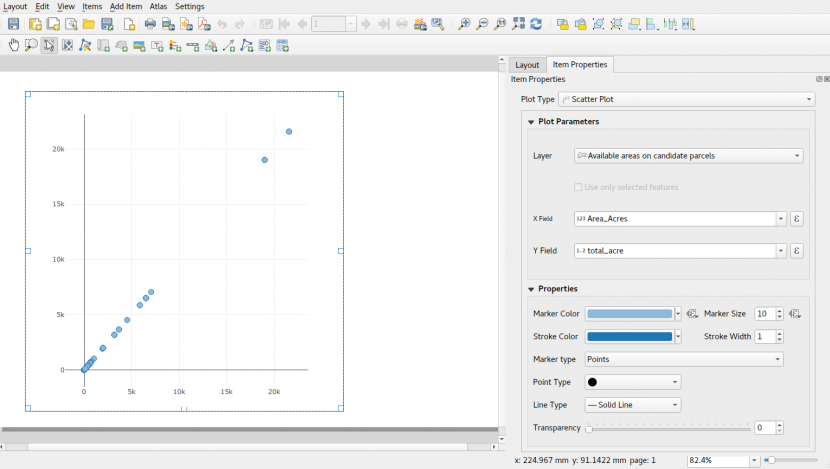
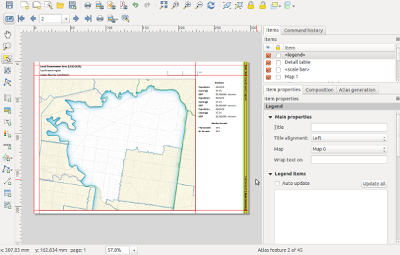
Last week saw the exciting release of version 3 of the QGIS DataPlotly plugin, which incorporates all the work done as a result of our Print Layouts Graphs and Charts crowdfunding campaign crowd funding campaign. Now, beautiful charts and graphs are available directly within QGIS print layouts, and all it takes is the easy installation of the “DataPlotly” plugin from your QGIS install! In this post we’ll showcase the functionality which has been added during this campaign, and which is available today in the plugin. UI modernisation and tweaks First up, during our work on this plugin we’ve invested some time in refreshing the plugin’s UI to ensure it follows all the widget conventions used elsewhere in QGIS. Now, the […]

Read more

QGIS Print Layouts Graphs and Charts — Beta Out Now!

Thanks to the success of our recent QGIS Print Layouts Graphs and Charts crowdfunding campaign, staff at North Road and Faunalia have been busy updating and improving the QGIS “DataPlotly” plugin with the goal of allowing beautiful charts inside your print layouts. We’re super-excited to announce that the beta release of this new functionality is now available! With this beta installed, you’ll see a new icon in your QGIS Print Layout designer window: Clicking this button will allow you to draw a new plot onto your print layout, just like you would any other standard layout item (like legends, scalebars, etc). Any print layout chart can be customised by right-clicking the chart and selecting “Item Properties“. This will open a […]

Read more

QGIS Print Layouts Graphs and Charts — target reached!

We’ve just passed the extended deadline for our recent QGIS Print Layouts Graphs and Charts campaign, and the great news is that thanks to a large number of generous backers we’ve successfully hit the target for this campaign! This has only been possible thanks to the tireless work of the QGIS community and user groups in promoting this campaign and spreading the word. The Print Layouts Graphs and Charts campaign is a joint effort with our friends at Faunalia, so we’ll soon be starting work together on all the wonderful new functionality heading to the QGIS DataPlotly plugin as a result. The work will be commencing late June, just after the QGIS 3.8.0 final release. Keep an eye out for […]

Read more

QGIS Print Layouts Graphs and Charts – campaign deadline extended!

If you’re a regular reader of this blog, it won’t surprise you to hear that we’re very excited about adding rich charting and graph functionality to QGIS’ Print Layout designer! Alongside our friends at Faunalia, we’re currently running a crowd funding campaign to make this a reality. So, while the required funds weren’t raised within our original April 30 deadline, we’ve decided to extend this campaign by an additional 30 days in the hopes that the users and organisations from the wider QGIS community will jump onboard and pledge the remaining required funds. This missing feature is a large gap in QGIS printing capabilities, so we’re counting on you to show your support and spread the word to your local […]

Read more

QGIS Print Layouts Graphs and Charts – an Illustrated Showcase

If you’ve been following our latest updates, you’ll be well aware that North Road and Faunalia are running a crowd funding campaign to add rich charting and graph functionality to QGIS’ Print Layout designer. This missing feature is a large gap in QGIS printing capabilities, so we’re planning on filling that gap by exposing the powerful QGIS “Data Plotly” plugin to allow these charts to be embedded inside your layouts, and allow them to be created and modified in a simple, interactive style. And thanks to a large group of generous backers, the campaign is off to a fantastic start! Accordingly, we’d like to take the opportunity to showcase some of the current plot styles available from the QGIS DataPlotly plugin, […]

Read more

QGIS Print Layouts Graphs and Charts crowdfund launched!

Ever wished QGIS had a way to insert dynamic, feature rich charts and graphs directly inside print layouts? If so, our latest crowdfunding campaign has you covered! This missing feature is a large gap in QGIS printing capabilities, so we’re planning on filling that gap by exposing the powerful QGIS “Data Plotly” plugin to allow these charts to be embedded inside your layouts, and allow them to be created and modified in a simple, interactive style. If you’re not aware of the existing capabilities of the DataPlotly plugin, here’s a quick screencast which should get you excited about the possibilities here… QGIS is already a reporting powerhouse, and we believe that linking DataPlotly with QGIS print layouts will boost the current […]

Read more

Exploring Reports in QGIS 3.0 – the Ultimate Guide!

In 2017 North Road ran a crowd funding campaign for extending QGIS’ Print Composer and adding a brand new reporting framework to QGIS. Thanks to numerous generous backers, this campaign was a success. With the final QGIS 3.0 release just around the corner, we thought this was a great time to explore the new reporting engine and what it offers. We’ll start with a relatively simple project, containing some administrative boundaries, populated places, ports and airports. Using the “Project” – “New Report” command, we then create a new blank report. Initially, there’s not much to look at – the dialog which is displayed looks much like the QGIS 3.0 Layout Designer, except for the new “Report Organizer” panel shown on […]

Read more

QGIS Composer Rewrite and Layout Engine crowdfund launched!

At North Road we believe that crowdfunding is a sustainable way to maintain and enhance open source software, like the QGIS open source GIS package. We’ve run a number of successful crowdfunding campaigns in the past, including support in QGIS for live layer effects, a point cluster renderer, and a unique value renderer for raster layers. Now, we’re proud to announce our latest crowd funding endeavour, and our biggest to date, the QGIS Layout and Reporting Engine Campaign. This campaign covers stage 1 of a large, ongoing project to modernise and expand on QGIS’ print composer and layout facilities. Over time QGIS’ composer functionality has grown extensively and now is capable of creating flexible, high quality cartographic outputs. However, we’ve now hit […]

Read more