QGIS Print Layouts Graphs and Charts — Beta Out Now!

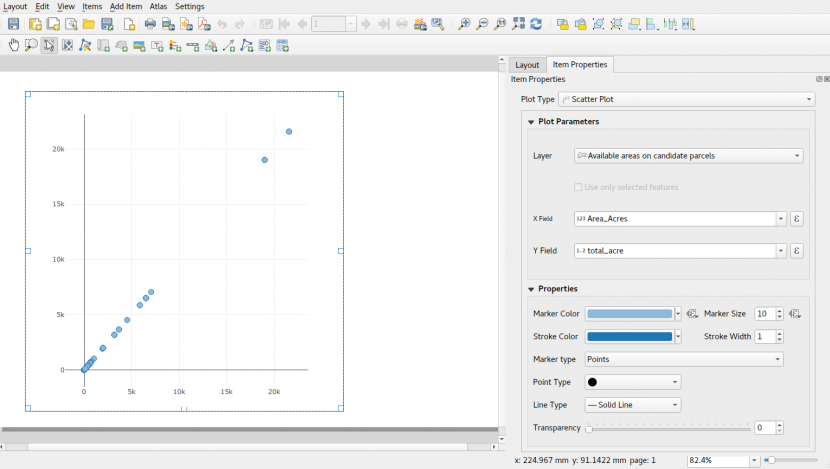
Thanks to the success of our recent QGIS Print Layouts Graphs and Charts crowdfunding campaign, staff at North Road and Faunalia have been busy updating and improving the QGIS “DataPlotly” plugin with the goal of allowing beautiful charts inside your print layouts. We’re super-excited to announce that the beta release of this new functionality is now available! With this beta installed, you’ll see a new icon in your QGIS Print Layout designer window: Clicking this button will allow you to draw a new plot onto your print layout, just like you would any other standard layout item (like legends, scalebars, etc). Any print layout chart can be customised by right-clicking the chart and selecting “Item Properties“. This will open a […]

Read more

QGIS 3.10 Loves GeoPDF!

Recently, we’ve been working on an exciting development which is coming soon in QGIS 3.10… support for Geospatial PDF exports! This has been a long-desired feature for many QGIS users, and it was only made possible thanks to a group of financial backers (listed below). In this post, we’re going to explore these new features and how they improve your QGIS PDF outputs. Geospatial PDFs can now be created either by exporting the main QGIS map canvas, or by creating and exporting a custom print layout. For instance, when you select the “Save Map as PDF” option from the main QGIS window, you’ll see a new group of Geospatial PDF related options: At its most basic, Geospatial PDF is a […]

Read more

QGIS Print Layouts Graphs and Charts — target reached!

We’ve just passed the extended deadline for our recent QGIS Print Layouts Graphs and Charts campaign, and the great news is that thanks to a large number of generous backers we’ve successfully hit the target for this campaign! This has only been possible thanks to the tireless work of the QGIS community and user groups in promoting this campaign and spreading the word. The Print Layouts Graphs and Charts campaign is a joint effort with our friends at Faunalia, so we’ll soon be starting work together on all the wonderful new functionality heading to the QGIS DataPlotly plugin as a result. The work will be commencing late June, just after the QGIS 3.8.0 final release. Keep an eye out for […]

Read more

QGIS Print Layouts Graphs and Charts – campaign deadline extended!

If you’re a regular reader of this blog, it won’t surprise you to hear that we’re very excited about adding rich charting and graph functionality to QGIS’ Print Layout designer! Alongside our friends at Faunalia, we’re currently running a crowd funding campaign to make this a reality. So, while the required funds weren’t raised within our original April 30 deadline, we’ve decided to extend this campaign by an additional 30 days in the hopes that the users and organisations from the wider QGIS community will jump onboard and pledge the remaining required funds. This missing feature is a large gap in QGIS printing capabilities, so we’re counting on you to show your support and spread the word to your local […]

Read more

QGIS (and SLYR!), now with Hash Lines support

Thanks to an anonymous corporate sponsor, we’ve recently had the opportunity to add a new Hashed Line symbol type for QGIS 3.8. This allows for a repeating line segment to be drawn over the length of a feature, with a line-sub symbol used to render each individual segment. There’s tons of options available for customising the appearance and placement of line hashes. We based the feature heavily off QGIS’ existing “Marker Line” support, so you can create hashed lines placed at set intervals, on line vertices, or at the start/end/middle of lines. There’s options to offset the lines, and tweak the rotation angle of individual hashes too. Added to QGIS’ rich support for “data defined” symbol properties, this allows for […]

Read more

QGIS Print Layouts Graphs and Charts crowdfund launched!

Ever wished QGIS had a way to insert dynamic, feature rich charts and graphs directly inside print layouts? If so, our latest crowdfunding campaign has you covered! This missing feature is a large gap in QGIS printing capabilities, so we’re planning on filling that gap by exposing the powerful QGIS “Data Plotly” plugin to allow these charts to be embedded inside your layouts, and allow them to be created and modified in a simple, interactive style. If you’re not aware of the existing capabilities of the DataPlotly plugin, here’s a quick screencast which should get you excited about the possibilities here… QGIS is already a reporting powerhouse, and we believe that linking DataPlotly with QGIS print layouts will boost the current […]

Read more

Announcing our SLYR (MXD to QGIS) funding drive!

One product which North Road had the chance to develop last year, and which we are super-proud of, is our SLYR ESRI style to QGIS conversion tool. If you haven’t heard of it before, this tool allows automatic conversion of ESRI .style database files to their equivalent QGIS symbology equivalent. It works well for the most part, and now we’re keen to take this to the next stage. The good news is that North Road have been conducting extensive research and development over the past 12 months, and we’re pleased to announce our plans for extending SLYR to support ESRI LYR and MXD documents. The LYR and MXD formats are proprietary ESRI-only formats, with no public specifications allowing their use. This […]

Read more

On custom layout checks in QGIS 3.6, and how they can do your work for you!

Recently, we had the opportunity to implement an exciting new feature within QGIS. An enterprise with a large number of QGIS installs was looking for a way to control the outputs which staff were creating from the software, and enforce a set of predefined policies. The policies were designed to ensure that maps created in QGIS’ print layout designer would meet a set of minimum standards, e.g.: Layouts must include a “Copyright 2019 by XXX” label somewhere on the page All maps must have a linked scale bar No layers from certain blacklisted sources (e.g. Google Maps tiles) are permitted Required attribution text for other layers must be included somewhere on the layout Instead of just making a set of […]

Read more

Edit Features “In Place” crowdfund — made it to QGIS 3.4!

Well, thanks to the resounding success of our QGIS edit-in-place crowdfunding campaign, we’ve been frantically smashing away at our keyboards in an attempt to reward the QGIS community by sneaking this feature in a whole 4 months earlier than originally promised! And, we’re very proud to announce, that this exciting new feature has been implemented and will be included in the upcoming QGIS 3.4 release (due late October 2018). So go ahead — grab one of the nightly pre-release of QGIS 3.4 and checkout the results. This wouldn’t have been possible without the rapid response to the campaign and the generosity of our wonderful backers: Alta ehf, Reykjavik, Iceland Kristianstads kommun, Sweden MBS Environmental, Perth, Australia Andreas Neumann Chartis Technology, […]

Read more

Edit Features “In Place” crowdfund — target reached!

Well, the final pledges have been tallied and we’re very proud to announce that our latest crowd funding campaign has been a roaring success! We’ve been completely blown away by the response to this campaign. Thanks to some incredibly generous backers and donors, we’ve been able to hit the campaign target with plenty of time to spare. As a result, we’ll be pushing hard to reward the generosity of the community by trying to sneak this feature in for the upcoming QGIS 3.4 release (instead of the originally promised 3.6 release)! You can read more about what we’re adding at the campaign page. We’d like to take this opportunity to extend our heartfelt thanks to all the backers who have pledged to […]

Read more